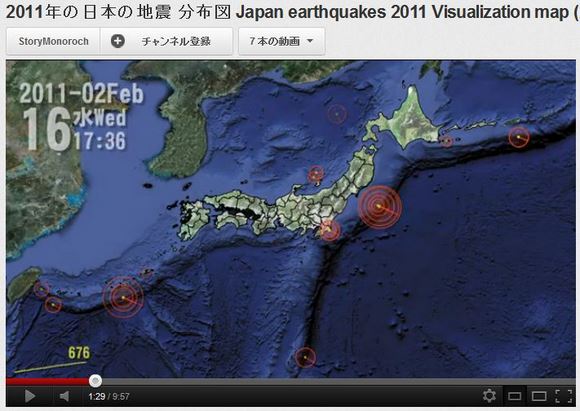
On March 11, an unprecedentedly large earthquake struck northern Japan, marking 2011 as a disastrous year for the Japanese. This video shows the fierce power of that quake and the cascade of aftershocks that came in the months to follow as nothing less than horrific.
Titled “Japan Earthquakes 2011 Visualization Map,” the video presents the distribution and severity of all the earthquakes that occurred in Japan with a very easy to understand system of circles and a graph. One can easily see the extent of trauma Japan experienced.
When March 11 rolls around in the video, suddenly Japan is struck by a shocking number of intense earthquakes, one after another without respite. To be honest, I was surprised that so many earthquakes could occur at the same time.
Or rather, to look at it from a different point of view, the video made me realize I had grown so accustomed to living through repeated earthquakes that I had lost some sense of their destructive power. There is also a similar video which shows earthquake on a global scale. Watching that, I was again impressed by Japan’s strength in enduring such an overwhelming amount of seismic activity.
It’s such an impressive visualization, I hope everyone will check it out. By the way, that yellow line that starts in the bottom left of the screen is the total number of earthquakes over time. It clearly shows how the occurrence of earthquakes became much more frequent.
This video shows the visualization for Japan.
This video shows the global one.
[ Read in Japanese ]