Wake up and smell the genomes.
As the old saying goes, “you are what you eat,” but recent research is showing that “we eat what we are” might be more accurate. In other words, our tastes and dietary habits might have more to do with what’s embedded in our DNA than we had previously thought.
One gene that has been of particular interest is ALDH2, which controls the enzymes used in alcohol metabolism. This is the same gene that results in redness that appears on the faces of many East Asians who partake of alcohol, but now is believed to be related to a number of other traits from alcohol dependence to quality of sleep, as well as other dietary preferences.
▼ Mr. Sato appears to have the ALDH2 genotype that processes alcohol fully, as his face remains fair after drinking. They only way you could tell he was wasted was the way he eats grated garlic from a jar.
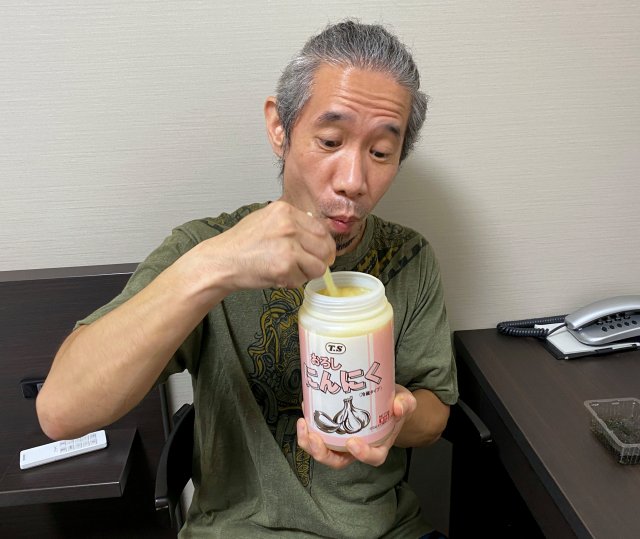 Image: ©SoraNews24
For example, according to Tokyo-based genome data analysis firm Euglena, the rs671 genotypes of ALDH2 have a relation to the amount of coffee someone likes to consume on a daily basis. Euglena then used the data of 20,000 people from all over Japan and found which prefectures have the most and least number of genetically predisposed coffee lovers.
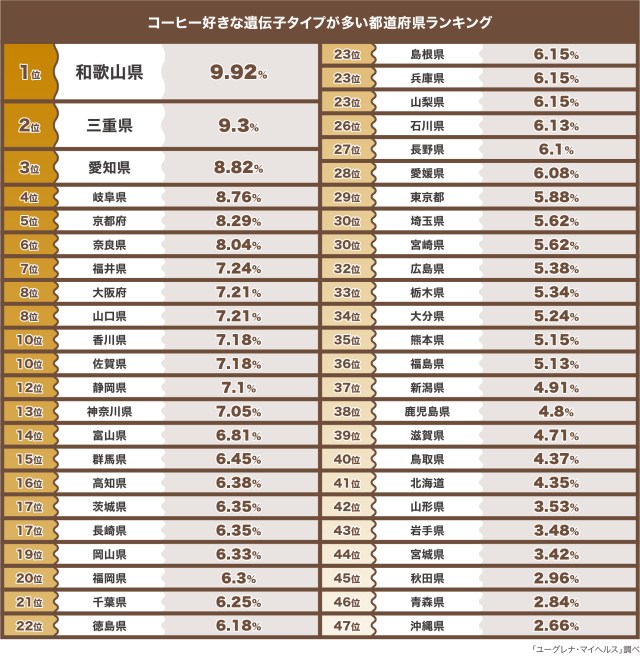
They also illustrated the results in this playfully coffee-colored heat map, in which darker areas represent the highest population of coffee-craving genotypes and vice versa.
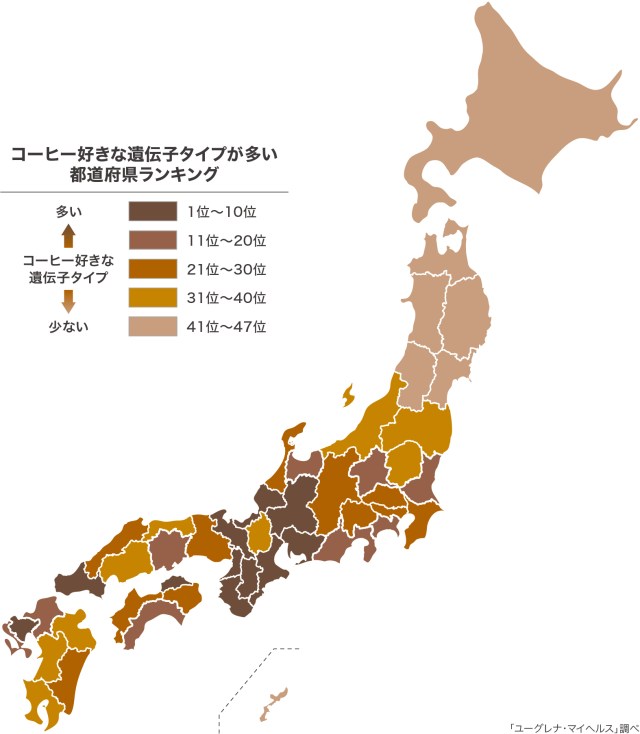
As we can see, there is a considerably stronger concentration of these people in the western part of Japan, particularly the Kansai region, composed of prefectures such as Osaka and Kyoto. As the detailed data reveals, four of the six main Kansai prefectures appear in the top ten genetically coffee-loving prefectures:
Prefectures with most people whose genes suggest they like coffee
1. Wakayama
2. Mie
3. Aichi
4. Gifu
5. Kyoto
6. Nara
7. Fukui
8 (tie). Osaka, Yamaguchi
10 (tie). Kagawa, Saga
Other prefectures like Mie and Fukui are sometimes grouped in with the Kansai area as well bringing the total up to six.
Conversely, the geographic extremities of Japan also seem to be the less susceptible to the aroma of freshly brewed coffee. The southern islands of Okinawa came in dead last among prefectures and northernmost Hokkaido ranked 41st out of 47.
▼ Full ranking in English listed at the end of this article
Interestingly, according to economic census data from the Ministry of Internal Affairs and Communication many of the same prefectures that tested highly for genetic predilection for coffee also have the most coffee shops per capita.
Prefectures with most coffee shops per capita (shops/1,000 people)
1. Kochi (1.56)
2. Gifu (1.43)
3 (tie). Aichi, Wakayama (1.13)
5. Osaka (1.06)
6. Hyogo (0.97)
7. Kagawa (0.93)
8. Kyoto (0.92)
9. Mie (0.86)
10. Fukui (0.83)
Although not in the top ten, Kochi was still a respectable 16th in terms of coffee-drinking genes. Its first-place performance here might also have been swayed by it having the third-lowest population in the country. Hyogo, on the other hand, is pretty far down the list at 23rd place but percentage-wise isn’t too far away from Kochi in terms of people with the genotypes in question.
In the end, this data does little more than provide some fun and perhaps highlight some prime opportunities to open coffee shops in Wakayama and Mie. But more importantly, the science behind it is bringing us closer to identifying potential lifestyle illnesses we might be at risk of falling victim to one on a genetic level without ever realizing it.
Full list of Japanese prefectures ranked by population of people genetically predisposed to drink coffee (percentage of population)
1.Wakayama (9.92)
2. Mie (9.3)
3. Aichi (8.82)
4. Gifu (8.76)
5. Kyoto (8.29)
6. Nara (8.04)
7. Fukui (7.24)
8 (tie). Osaka, Yamaguchi (7.21)
10 (tie). Kagawa, Saga (7.18)
12. Shizuoka (7.1)
13. Kanagawa (7.05)
14. Toyama (6.81)
15. Gunma (6.45)
16. Kochi (6.38)
17 (tie). Ibaraki, Nagasaki (6.35)
19. Okayama (6.33)
20. Fukuoka (6.3)
21. Chiba (6.25)
22. Tokushima (6.18)
23 (tie). Shimane, Hyogo, Yamanashi (6.15)
26. Ishikawa (6.13)
27. Nagano (6.1)
28. Ehime (6.08)
29. Tokyo (5.88)
30 (tie). Saitama, Miyazaki (5.62)
32. Hiroshima (5.38)
33. Tochigi (5.34)
34. Oita (5.24)
35. Kumamoto (5.15)
36. Fukushima (5.13)
37. Niigata (4.91)
38. Kagoshima (4.8)
39. Shiga (4.71)
40. Tottori (4.37)
41. Hokkaido (4.35)
42. Yamagata (3.53)
43. Iwate (3.42)
44. Miyagi (3.42)
45. Akita (2.96)
46. Aomori (2.84)
47. Okinawa (2.66)
Source: PR Times
Top image: ©SoraNews24
Insert images: PR Times (unless otherwise noted)
● Want to hear about SoraNews24’s latest articles as soon as they’re published? Follow us on Facebook and Twitter!
 Online survey sheds light on prefectural personality rankings of Japanese people
 Japan’s favorite Pokémon types by prefecture–which types are the most popular?
 Cup Noodle releases cold-water instant ramen in Japan, but can it really be made with just cold water?
 Japanese convenience store releases Japanese convenience store-flavor fried chicken
 Hatsune Miku collaborates with Hokusai’s art in new Vocaloid ukiyo-e illustration series [Pics]
 Japan’s “edible fireworks” wagashi sweets return, but only for a limited time [Photos]
 Studio Ghibli releases anime T-shirts that pay homage to one of Hayao Miyazaki’s most personal films
 Japan now has human refrigerators inspired by Japanese vending machines
 Giant Snorlax, other snoozing Pokémon appear in Yokohama for Pokémon Sleeping Faces Research [Pics]
 Starbucks Japan unveils new peach milk pudding drink that’s like a decadent dessert
 Japan’s popular curry chain Cocoichi has an elusive delivery-only noodle menu
 Family Mart’s new Tokyo flagship convenience store doesn’t feel convenient, but is that a problem?
 Cup Noodle unveils first-ever cold-water instant ramen in Japan
 Starbucks Japan releases new Discovery Series collection celebrating local regions and traditions
 Teen girl in Japan refuses to be victim, personally escorts train pervert to police for arrest
 Japanese government ID card and app to be required for certain Pokémon card purchases next month
 Is Japan’s tourism boom slowing down? Foreign visitor numbers fall for first time in five years
 Japan announces sudden 400-percent increase in visa fees for foreigners entering the country
 Studio Ghibli has a new anime out, and there’s only one place in the world where you can see it
 Salomon releases Japan-exclusive Mt. Fuji hiking gear that doubles as an amazing souvenir
 Japanese ninja certification exam attracts 131 candidates from Japan and abroad
 Japan triples departure tax, foreign tourists and locals now must pay more to leave country
 Family Mart opens new “Famima” flagship store in Tokyo that’s like a tourist attraction
 Japan’s human washing machines will go on sale to general public, demos to be held in Tokyo
 Starbucks Japan releases new drinkware and goods for Valentine’s Day
 Starbucks Japan releases new sakura goods and drinkware for cherry blossom season 2026
 Japan’s newest Shinkansen has no seats…or passengers [Video]
 Put sesame oil in your coffee? Japanese maker says it’s the best way to start your day【Taste test】
 Japan reportedly adding Japanese language skill requirement to most common foreigner work visa